In this issue
- Performance and persistence: one & ten-year endowment returns
- Index and go home? Not so fast!
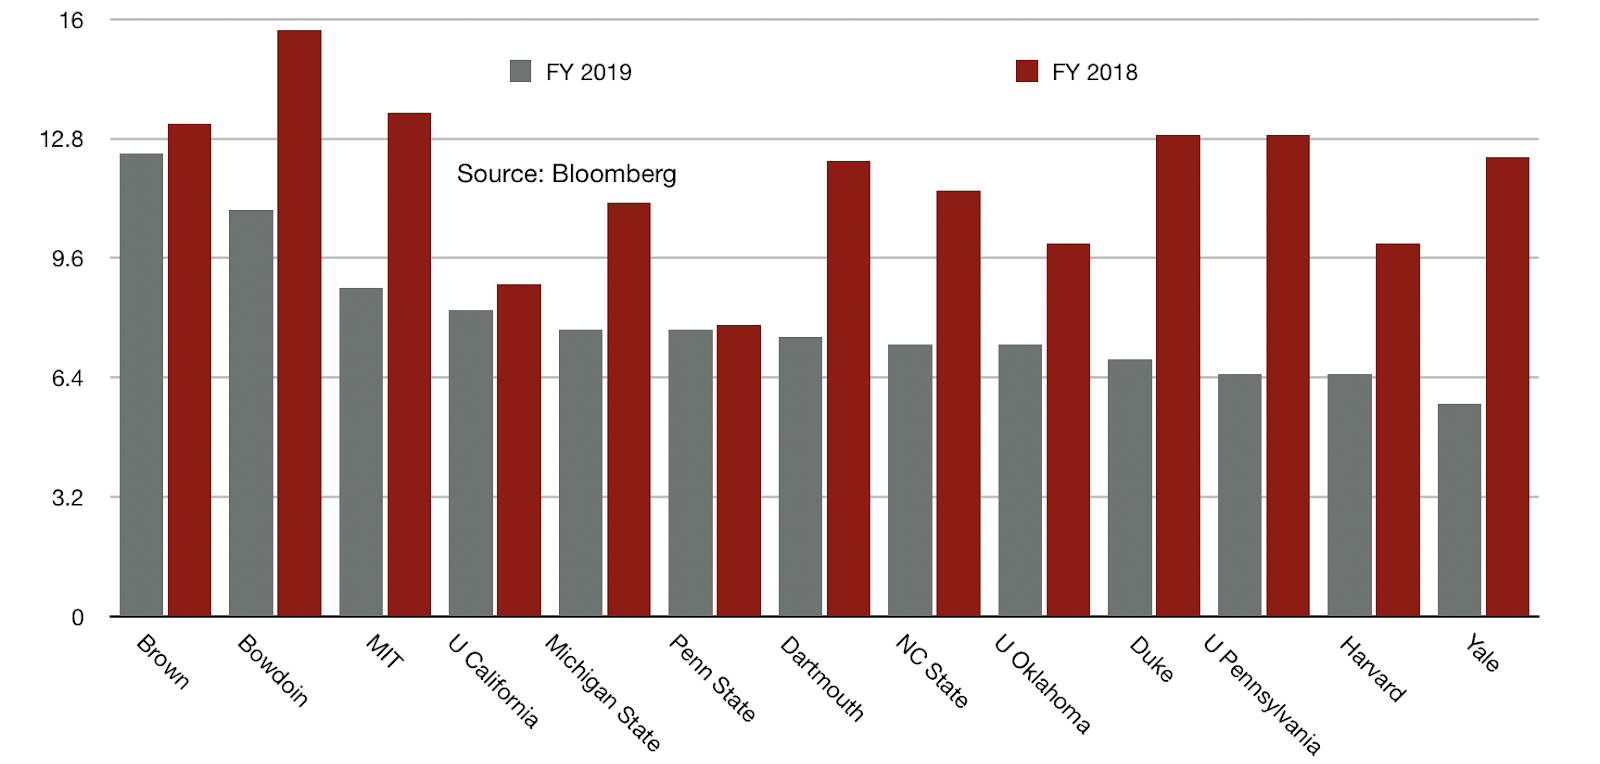
CIOs earn their keep: one and ten-year endowment performance
Our FY2019 institutional investment update presents the latest one and ten-year returns for sixty endowments.
We consider ten-year returns to be a rigorous and revealing measure of the strength of an institution’s oversight and investment abilities.
Despite rumblings to the contrary, our latest research shows that many nonprofit chief investment officers – and their boards – deliver meaningful value to their institutions.
The road to riches
Most high-performance investment offices on our list have stable boards and long serving CIOs.
It takes years to fully implement a multi-asset, multi-generational investment strategy and altering course mid-stream – a new investment chair? a change in CIOs? – can sap performance for a decade.
We recruit these executives for a living and avidly follow all institutional investment heads managing assets over $1 billion (and many with less), tracking their performance and scrutinizing their abilities.
They may have a down year or two but, as we spotlighted in an earlier report, top chief investment officers stay on top.
And now, on to the table for our fresh-from-the-oven, pre-Thanksgiving performance chart!
|
Endowment Performance 2019 |
|||||
|
– |
Institution (Endowments > $1bn) |
Chief Investment Officer |
AUM |
1-yr Rtn |
10-yr Rtn |
|
– |
– |
– |
– |
– |
– |
|
1 |
Bowdoin College |
Volent, Paula |
1.74 |
10.90 |
12.00 |
|
2 |
Massachusetts Institute of Technology (MIT) |
Alexander, Seth |
17.44 |
8.80 |
11.60 |
|
3 |
Princeton University |
Golden, Andrew |
26.10 |
6.20 |
11.60 |
|
4 |
Yale University |
Swensen, David F. |
30.30 |
5.70 |
11.10 |
|
5 |
University of Virginia |
Durden, Robert |
9.60 |
5.80 |
11.00 |
|
6 |
Dartmouth College |
Ruth, Alice A. |
5.70 |
7.50 |
10.70 |
|
7 |
University of Notre Dame |
Malpass, Scott C. |
13.80 |
7.20 |
10.60 |
|
8 |
Carnegie Mellon University |
Kennedy, Charles (Chuck) A. |
2.00 |
7.90 |
10.50 |
|
9 |
Rice University |
Thacker, Allison K. |
6.48 |
7.57 |
10.44 |
|
10 |
Duke University |
Triplett, Neal F. |
8.60 |
6.90 |
10.40 |
|
11 |
University of Pennsylvania |
Ammon, Peter H. |
14.70 |
6.50 |
10.30 |
|
12 |
Baylor College of Medicine |
Walker, William D. |
1.3 |
5.80 |
10.30 |
|
13 |
Swarthmore College |
Amstutz, Mark C. |
2.14 |
7.20 |
10.30 |
|
14 |
Stanford University |
Wallace, Robert |
29.60 |
6.50 |
10.20 |
|
15 |
Columbia University |
Holland, Peter |
10.95 |
3.80 |
10.20 |
|
16 |
Wesleyan University |
Martin, Anne |
1.10 |
4.30 |
10.00 |
|
17 |
Brown University |
Dietze, Jane A. |
4.20 |
12.40 |
10.00 |
|
18 |
University of Oklahoma |
Johnson, Bradley J. |
1.37 |
7.01 |
9.80 |
|
19 |
Pennsylvania State U |
Cullen, Joe (joined 9-2019) |
3.11 |
7.70 |
9.80 |
|
20 |
U Arkansas, OCIO Cambridge Associates |
Ferguson, Vickie, Dir Investments |
1.83 |
5.90 |
9.70 |
|
21 |
Northwestern (6/30/19 rtns) |
McLean, William H. |
11.00 |
4.30 |
9.50 |
|
22 |
Pomona College |
Wallace, Dave |
2.30 |
6.50 |
9.50 |
|
23 |
University of Iowa |
Bethea, Jim |
1.58 |
3.40 |
9.50 |
|
24 |
Rockefeller University |
Falls, Amy C. |
2.20 |
8.50 |
9.40 |
|
25 |
NC State U & Foundations |
George, Libby |
1.40 |
7.30 |
9.40 |
|
26 |
U of California Regents |
Bachher, Jagdeep S. |
13.40 |
8.20 |
9.40 |
|
27 |
Boston College (6/30/19 rtns) |
Zona, John J. |
2.60 |
4.80 |
9.40 |
|
28 |
University of Rochester |
Phillips, Douglas W. |
2.60 |
6.30 |
9.40 |
|
29 |
Phillips Academy, Andover |
Glantz, Kirsten Landers |
1.10 |
6.00 |
9.40 |
|
30 |
Amherst College |
Johnson, Letitia |
2.40 |
7.24 |
9.37 |
|
31 |
Tulane University |
Jeremy T, Crigler |
1.40 |
5.40 |
9.20 |
|
32 |
Texas Christian University |
Hille, James R. |
1.70 |
6.00 |
9.20 |
|
33 |
Indiana U & Foundation |
Stratten, Gary A. |
2.32 |
5.50 |
9.20 |
|
34 |
U of Minnesota OIB |
Mason, Stuart |
1.48 |
8.30 |
9.10 |
|
35 |
Washington U, St. Louis |
Wilson, Scott |
8.90 |
7.40 |
9.10 |
|
36 |
University of Chicago |
Schmid, Mark |
8.50 |
6.90 |
9.10 |
|
37 |
Texas Permanent School Fund |
Timmins, Holland |
34.60 |
6.10 |
9.10 |
|
38 |
Emory University |
Pulavarti, Srinivas “Srini” |
7.13 |
9.05 |
9.05 |
|
39 |
U N. Carolina, Chapel Hill Fdns *AUM includes all UNC system schools |
King, Jonathan |
6.60 |
7.70 |
9.00 |
|
40 |
UTIMCO (U Tx & Tx A&M) |
Harris, Britt |
34.10 |
5.00 |
9.00 |
|
41 |
University of Missouri |
Richards, Thomas “Tom” F. |
1.74 |
5.70 |
9.00 |
|
42 |
U Minnesota Foundations |
Gorence, Doug |
2.50 |
9.20 |
9.00 |
|
43 |
California Institute of Technology (Caltech) (6/30/19 rtns) |
Richland, Scott H. |
3.00 |
9.10 |
8.90 |
|
44 |
University of Washington |
Ferguson, Keith |
3.60 |
5.80 |
8.90 |
|
45 |
Michigan State University |
Zecher, Phil |
3.03 |
7.90 |
8.90 |
|
46 |
U Georgia & Foundations |
Bull, Jason |
1.13 |
4.50 |
8.80 |
|
47 |
University of Cincinnati |
Scheer, Karl L. |
1.45 |
5.30 |
8.80 |
|
48 |
U Illinois Foundation |
Ellison, Ellen J. |
1.80 |
2.60 |
8.70 |
|
49 |
Cornell University |
Miranda, Ken |
7.30 |
5.30 |
8.60 |
|
50 |
Harvard University |
Narvekar, Nirmal |
40.90 |
6.50 |
8.50 |
|
51 |
Iowa State U & Foundation |
Eslinger, Lisa – CFO & CAO |
1.26 |
5.20 |
8.50 |
|
52 |
University of Miami |
Maynard, Charmel – VP Investment & Treasurer |
1.05 |
5.25 |
8.48 |
|
53 |
Rutgers University, NJ |
MacDonald, Jason |
1.48 |
5.20 |
8.40 |
|
54 |
University of Nebraska Fdn |
Neale, Brian |
1.70 |
2.10 |
8.10 |
|
55 |
University of Kentucky |
Shupp, Todd |
1.57 |
5.5 |
8.00 |
|
56 |
Ohio State University |
Lane, John C. |
5.30 |
1.20 |
7.97 |
|
– |
60/40 MSCI ACWI Barclays Domestic US Agg* |
– |
– |
6.26 |
7.90 |
|
57 |
U of Florida Foundation |
Reeser, William S. |
1.80 |
7.00 |
7.90 |
|
58 |
Lehigh University |
Agatone, Kristin |
1.60 |
7.70 |
7.70 |
|
59 |
Case Western Reserve University |
Milanich, Tim R. |
1.87 |
5.90 |
7.50 |
|
60 |
Southern Methodist University |
Dahiya, Rakesh (June 30) |
1.67 |
3.50 |
7.40 |
|
– |
– |
– |
– |
– |
– |
|
– |
60/40 MSCI ACWI Barclays Global Agg* |
– |
– |
6.10 |
7.40 |
* Note 1. A puzzle? We requested 60/40 MSCI Barclays Agg indexes from five different reputable sources and got five different answers?
*Note 2. We lean heavily on university endowments for our performance studies and benchmarks because that’s where the data is. Foundations, family offices, and Wall Street firms employ excellent investment professionals, but it’s difficult to extract meaningful data.]
Beating a 60/40
We used both a Barclays Global bond Agg and Barclays US bond Agg index in our 60/40 benchmarks because not all US nonprofits invest in foreign debt.
Reviewing these returns, it’s evident that most big-league CIOs performed well over the decade, despite an occasional short-term reversal.
Data from Cambridge Associates agrees with our observations.
Their research, which tracks CIO performance within the CA universe of nonprofits, found that investment heads often underperform an average three years out of ten.
Performance in those other seven years, however, more than make up for the down-swings.
Why not index and go home?
We’ve spoken with anxious board members recently who question the value of an investment office.
Their thinking goes something like this. “What good is active management when my returns have been sub-par for years. Meanwhile, I’m paying a fortune in fees, commissions, and carry. Why shouldn’t we just index and be done with the hassles?
Proponents of indexing make two basic arguments; it’s hard to beat the market over time, and costs undermine returns.
Standard & Poor’s issues a semi-annual S&P Down Jones Persistence Scorecard which shows that, year after year, few managers investing in public market securities stay on top for long.
And Vanguard‘s flagship paper on indexing, The case for low-cost index fund investing, argues that over the long term most investors’ best chance at maximizing net returns lies in minimizing costs.
But as one top-decile CIO emailed me recently, “this is a very hard ten-year period for comparisons. Year zero was about the nadir of the great financial crisis and the subsequent flood of capital has buoyed and distorted asset prices.”
While indexing may make sense for some, those institutions on our performance list will probably keep what’s worked well for them.
It ain’t easy being chief
Chief investment officers wear many hats and remain on call twenty-four seven – see our interviews with Kim Lew at the Carnegie Corporation and Anastasia Titarchuk at the NY Commons.
They work with boards, donors, administrations, plan participants, voters, and skeptical reporters.
They facilitate and implement strategy, match assets and liabilities, maintain liquidity and spending levels, and navigate capricious politics and policies.
In the end, superior investment performance depends upon hiring the right people and staying the course.
In a world of change and uncertainty, chief investment officers have proven their mettle.
————————————————-