Family Wealth: Finding Purpose, Fighting Entropy
by charles | Comments are closed01/15/2019

It is better to have a permanent income than to be fascinating.
– Oscar Wilde
A conversation with Stuart Lucas: wealth manager, educator, and family scion
Stuart Lucas has double-barreled credentials as a wealth manager.
He’s a Harvard MBA who worked for years with top-shelf financial firms including Wellington Management Company and Banc One (now JP Morgan Chase), where he led their Ultra HNW unit.
And, he is himself an heir to family money by way of his great-grandfather, E. A. Stuart, who founded the Carnation Company. In 1985, the closely-held business was sold to Nestle, and the proceeds were distributed among Mr. Stuart’s descendants.
In 2004, Mr. Lucas merged his professional and personal worlds by founding Wealth Strategist Partners, which continues today as the investment advisor to his and selected other family offices.
He has gone on to design and lead a Private Wealth Management executive education program, designed specifically for wealthy families at the University of Chicago Booth School, now in its 12th year. And, as an adjunct professor, he has taught a Wealth and Family Enterprise Management course at the MBA level.
All this experience has also been distilled into his widely-read book, Wealth: Grow It and Protect It, for general readers; and into academic-quality papers for The Journal of Wealth Management.
We’re delighted that he made some time to talk to us.
Keeping it in the family
Skorina: Stuart, you’ve focused on high-net-worth families and their money for decades as a practitioner; an academic; and even personally, as a member of an extended, affluent family. You probably know as much about this stuff as anyone in the business.
Where do you begin with a new client who has to deal with all of this for the first time?
Lucas: Charles, it’s true I’ve been doing this for quite a while, but no one knows everything about it. I learn something new every day.
A family office with significant wealth has many moving parts. There’s money-management per se, which you focus on; and it’s crucial.
But, there are also the structural, legal, and tax issues. And there are opaque but vital intra-familial and cultural issues that have to be dealt with. They’re all important, and all inter-related.
The laws and tax rates keep changing, so do markets, and so do the families themselves. We try to design and execute an integrated strategy that balances all these elements.
Skorina: So, how do you start the conversation with a new client?
Read More »Five-year endowment performance: no bed of roses
by charles | Comments are closed12/19/2018

Five-year endowment performance: no bed of roses
Chief investment officers at endowments, foundations, and family offices are the top guns of the institutional investment world. They have an infinite investment horizon, a global playing field, and can invest in anything anywhere – within the broad policy limits set by their institution.
We, and many others, regard the CIOs at major American universities and foundations as the best of the best.
We lean heavily on university endowments for our performance studies and benchmarks because that’s where the data is.
Foundations, family offices, and Wall Street firms employ top investment professionals, but it’s difficult to extract meaningful data from opaque sources. So, we go with what we can get.
A five-year return: the Goldilocks number
Institutions go on forever, but chief investment officers unfortunately don’t.
Five-year returns give us a good — albeit imperfect – picture of how CIOs are doing their jobs. A longer timeframe would blur the responsibility for results as CIOs come and go.
In our chart below, the median tenure of CIOs happens to be exactly 5 years. (The mean is higher, tipped by a handful of very senior CIOs.)
In our SEER reports (aka: Skorina’s Enhanced Endowment Reports) we use the five-year rankings for our own headhunting purposes, and we let you look over our shoulders.
Boards and investment committees set broad policies. Executing those policies in the day-to-day scrum of the markets — especially in the hiring, firing and monitoring of external managers — is the province of the CIO and his/her staff. As recruiters, we try to understand who’s doing it well, or not so well.
Risk versus return – it’s personal
We know that nominal returns don’t reflect the different risk-appetites of different investors; and ranking doesn’t tell the whole story.
There may be good reasons why one institution prefers a more, or less, conservative risk-return trade-off versus its peers. We’ll say more on that point down below. But five-year nominal return is our starting point.
Our dataset consists of 34 big, over $1 billion AUM, North American endowments reporting as of early December.
That’s only about a third of the whole big-endowment roster. It leaves about 50 who have yet to be heard from, and another dozen or so who disdain to report their returns at all, even when we ask politely.
But our gang of 34 is big enough to show us how the whole league has performed, and it includes many of the brand-name schools and all the traditional Ivys.
Read More »Chief Investment Officer Pay in 2018/2019
by charles | Comments are closed12/08/2018

Our projections – Growth slowing to 7 percent for endowment CIOs
Back in October, we reported the latest-available compensation numbers for 74 chief investment officers at the biggest (over-$1 billion AUM) endowments.
We used the most recent filings for our data, but those numbers (for calendar year 2015) were already pretty stale.
As we said then, the hitch is the long time-lag — more than two years — before IRS data is publicly available.
Now we’re back with our own estimates of what these CIOs are actually making right now, in real time, extrapolating from 2015 to 2018.
We find that typical CIO pay has been growing at a compound rate of more than 7 percent per year
We looked at a large subset of those original 74 CIOs, 32 who had held office for five consecutive years, 2011 to 2015. It’s a big enough and inclusive-enough subset (big and small, public and private, geographically diverse) that we feel comfortable projecting our findings to the whole population of 74 CIOs.
From that time-series we projected out three more years to get point-estimates for 2018.
(To be clear, this is total W2 compensation, including base, bonus and “other” as classified by the IRS. It omits other benefits which are not taxable to the CIO, but which may be significant.)
The median big-endowment CIO made approximately $609,000 in 2011. Five years later, in 2015, he or she was making about $1,100,000. That’s a rise of about 80 percent over five years.
Stated as a compound annual growth rate (CAGR), that’s 12.6 percent per year.
But that’s based on historical data. We then needed to push our trendlines out from 2015 to 2018, for which we have no data. So, stand back, some freshman math is required.
We found that CIO pay is still growing briskly, but that the growth rate seems to be slowing in recent years.
From 2015 to 2018, we estimate that the median CIO in our sample grew his/her pay from $1,100,000 to $1,380,000, for a rise of 26percent over three years.
As a CAGR, that’s 7.1 percent per year.
The chart below shows the pay for the 32 CIOs in our study and projections for the 21 who are still in office this year.
Read More »Compensation and chief investment officers
by charles | Comments are closed11/04/2018

Who are the best-paid endowment CIOs?
Compensation is a delicate issue; but recruiters need to keep track of it. And, we see no reason why we shouldn’t share some of that bounty with our readers. (See our complete compensation chart just below.)
Most of it is publicly available, anyway; as long as you’re willing to scrounge for it. Private schools and some publics disclose it in IRS filings. The hitch is the long time-lag — more than two years — before the data is publicly available. The corresponding data for most public schools is often fresher, but it’s scattered among various and often quirky databases in various jurisdictions with various disclosure rules.
It’s ironic that data for public colleges has sometimes been the least public. But that’s changed somewhat in recent years as more states adopt sunshine laws for public-employee pay generally. Or, you can file a FOIA request. But it’s been like pulling teeth in many places.
And, even when public-school CIO comp is published, it can’t always be trusted. Clever college administrators have sometimes found (or constructed) loopholes in those sunshine laws which let them conceal part of the CIO pay-package.
A recent and noisy case in point arose in Michigan. The official University of Michigan salary-disclosure listing (page 447) for 2017 showed CIO Erik Lundberg’s total comp as $720,000.
We’ve been skeptical of that number for a while, but the U was eventually prodded into disclosing that Mr. Lundberg actually made $2 million in 2017.
Although the gross number had become public, the Detroit Free Press still sued the University to obtain details about how it was calculated.
The judge sided with the Freep, but the university argued that they had legitimate reasons for keeping them private.
“Despite the court’s ruling, we believe disclosure of the … Incentive Plan will put U-M at a competitive disadvantage,” a school spokesman said. “Because there are very few public universities in our endowment peer group, virtually no comparison [sic] schools will ever have to make their plans public. These are the employers against which the university competes for talent recruitment and retention.”
The fact that a major university would go to some trouble to avoid disclosing that information does speak to the highly competitive market for top CIOs. If you have a good one (and Mr. Lundberg is very good), there’s always anxiety that someone with deeper pockets will whisk him or her away. And, if you’re crafting a competitive offer, it certainly helps to know exactly what you have to beat.
As the Lundberg case confirmed, these pay packages are complex. In our chart below, we can only offer the bare numbers.
Read More »CA vs NY: Performance and pay at the Mega-pensions
by charles | Comments are closed07/31/2018
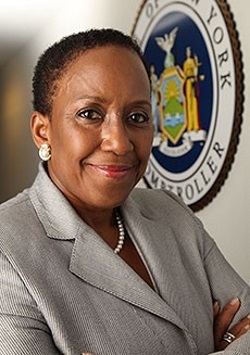
Vicki Fuller, chief investment officer at the country’s third-biggest public pension — New York State’s Common Retirement Fund – has announced her retirement by the end of this summer of 2018.
We just had a chance to chat with her about her life and times. But first, here are a couple of mini-charts to put everything in perspective.
As of September 2017, there were only three U.S. pensions with over $200 billion in assets – two in California, and one in New York. Here’s how Ms. Fuller’s fund stacks up against the Californians.
Read More »