Kim Lew, Columbia Endowment’s next CEO, Shattering the Glass Ceiling
by charles | Comments are closed09/08/2020
African-American investment professionals. . . better late than never!
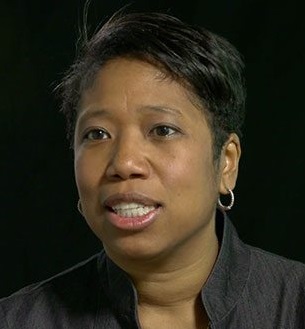
Last week Columbia University announced that Ms. Kim Y. Lew, chief investment officer and thirteen-year veteran of the Carnegie Corporation, will join Columbia’s $10.9 billion Investment Management Company as CEO on November 2nd.
She won’t have far to move. Her new office is located about eight blocks south and three blocks east of her present location in mid-town Manhattan.
This hire is a big deal and the search committee — Columbia University’s board of directors, President Lee C. Bollinger, and EVP of finance Anne Sullivan — shattered several glass ceilings when they welcomed Ms. Lew on board.
Gender is a formidable barrier for females in finance. On our latest list of the top one hundred endowment chief investment officers pre-Ms. Lew, there are only sixteen women.
[This is pre-Kim Lew and Brooke Jones, both moves announced last week. Ms. Jones was Kim Lew’s investment director and will move to Bryn Mawr College as CIO next month. Dekia Scott, 19 years at Southern Company, was promoted to CIO in June]
Fortunately, Columbia’s search committee was more interested in talent and ability than race, gender, or religion when they selected Ms. Lew.
[Our full interview with Ms. Lew is just below]
We see a lot of boilerplate in the nonprofit world about how “we don’t discriminate.”
But, truth be told, if you are a woman, or more pointedly, an African-American woman in asset management, you face gale-force headwinds as you scale the institutional precipice.
How bad is it?
For over thirty years we have followed the careers of several thousand investment heads at Wall Street investment and money center banks, hedge funds, insurance companies, and nonprofits.
Within our global database we have about six-hundred-fifty chief investment officers at endowments, foundations, hospitals, public pensions, associations, and charities. . . yet we can find only fifteen African-American CIOs among them, a minuscule two percent, of which, with the recent promotions of Ms. Jones, and Scott, seven are female.
The dismal reality is that an African-American woman working in institutional investment management has a better chance of storming her way across the Korean DMZ than becoming a chief investment officer at a major American endowment or foundation.
AFRICAN-AMERICAN CHIEF INVESTMENT OFFICERS
AT US TAX-EXEMPT INSTITUTIONS
—————————————————
ENDOWMENTS
Kim Y. Lew, CEO (Oct 2020), Columbia U Investment Mgmt. Co.
Brooke Jones, CIO (Oct 2020), Bryn Mawr College
Charmel Maynard, CIO/Treasurer, U of Miami, FL
Frank Bello, CIO Howard U
Robert “Danny” Flanigan Jr., CIO/Treasurer, Spelman College
—————————————————
FOUNDATIONS
Joseph Boateng, CIO, Casey Family Programs
Rukaiyah Adams, CIO, Meyer Memorial Trust
Nickol Hackett, CIO, Joyce Foundation
Bola Olusanya, CIO, The Nature Conservancy
—————————————————
CORPORATE PENSIONS
Dekia M. Scott, CIO, Southern Company
Bryan Lewis, CIO, US Steel
—————————————————
PUBLIC PENSIONS
Mansco Perry III, ExecDir/CIO, MN State Board of Investments
Angela Miller-May, CIO, Chicago Teachers’ Pension Fund
Cheryl Alston, CIO, Employees Retirement Fund City of Dallas
Alex Done, CIO, Bureau of Asset Management, NYC retirement system
—————————————————
Source: Charles Skorina & Company
[Our apologies if we have missed anyone. Please email me if you’re not on the list]
Kelli Washington, managing director of investments at the Cleveland Clinic, wrote an excellent op-ed piece for ai-CIO magazine about what it’s like to be an African-American woman in finance.
And Vicki Fuller, former CIO at the New York Commons, was kind enough to share her views on being female and African-American on Wall Street and at the Commons in our interview two years ago.
We should mention that Columbia is not the only eminent New York institution to give women and minorities a fair shot.
The honorable Thomas P. DiNapoli, state comptroller, has led the charge for years, promoting Raudline Etienne, then Vicki Fuller, and now Anastasia Titarchuk to the top investment position at the $207bn New York Commons.
But, as we see from the data, these are rare exceptions.
When I interview women in the investment industry and ask how they first became interested in investment finance, it’s almost always because early on they had a role model.
Someone in the family or a family friend, someone they met in high school or college who worked in finance and took the time to explain what they did and why they liked the job.
Let’s hope the entire investment community will follow Columbia’s example and hire, develop, and promote more role models like the intrepid band of women (and men) cited in this piece.
Ms. Kim Y. Lew, a Bronx Story
Read More »Endowments and Donors Can’t Save Higher Ed
by charles | Comments are closed08/24/2020

American colleges, cultural institutions, and health systems are in deep trouble.
Tuition, room and board revenue, government aid, donor gifts, visitor and patient revenue have all collapsed.
Staff and pay cuts have hit many of the well-known institutions we work with and more are in the works.
College campuses are hard hit
Terry Hartle, senior vice president at the American Council on Education, estimated in a recent PBS interview that colleges and universities have taken an aggregate twenty percent hit to their budgets so far in 2020.
Most schools think 2021 will be much worse.
The late Harvard professor Clayton M. Christensen (The Innovator’s Dilemma) predicted a few years ago that half of America’s 4000 colleges and universities would go bankrupt in the next decade or two, as online education “disrupts” the business models of traditional institutions and runs them out of business.
With the accelerated shift to on-line learning thanks to the Covid-19 crisis, parents and students are up in arms against the price of a college education. Mr. Hartle cites $8 billion in refunds this spring just for room and board cancellations.
The cost crisis in higher education has been fermenting for years as states cut education budgets and colleges jacked up tuition and fees.
Scott Galloway, professor of marketing at NYU, points out that tuition has jumped two-and-a-half times in twenty years while the educational “product” has essentially stayed the same.
But the reckoning was delayed by waves of full-fee foreigners and full-recourse student loans.
As students grow accustomed to remote coursework, one wonders how many families will be willing to pay forty thousand and more per year for an off-site experience indistinguishable from every other.
Endowments and donors can only do so much
Our system of higher education – including the great private universities and the endowments that support them – is a key asset in our national preeminence.
Endowment capital has been a bedrock source of support for generations of students and faculty, but it takes a long time to accumulate and it’s very tempting to plunder.
Cambridge, the wealthiest university in Europe, took over 800 years to amass an endowment of $9.3 billion. Harvard’s $41 billion took 382 years to accrue. Upstart Stanford University grew its endowment to $27.7.4 billion in “just” 135 years.
And that “hoarded” wealth drove performance; American universities dominate the rankings of global higher education.
Denuding a university’s long-term legacy to plug short-term budgetary holes may be politically expedient but it merely postpones the inevitable plunge off the fiscal cliff.
Time to cut the fat
Voluntary support from alumni, foundations, corporations, and religious groups have helped our higher-education system grow at an unparalleled rate while achieving remarkable diversity and unquestioned world leadership.
But donors, endowments, and flush foreigners can’t save higher education from the inescapable abyss without fundamental changes in costs and delivery.
Re-engineering and re-pricing the college experience at a level families can afford is daunting but essential if we wish to maintain the level of excellence we’ve enjoyed since our nation’s beginning.
University alumni and endowment staffs have stepped up time and again to support their schools when the going got rough.
It’s time for our universities and colleges administrators to do the same.
Read More »Endowment Returns 2019: 100 Benchmarks to Remember
by charles | Comments are closed08/05/2020

Most nonprofit funds – endowments, foundations, health systems, etc. – close their books for the fiscal year on June 30 and release preliminary performance results soon thereafter.
Timing is everything
For the last decade, public and private market investments have moved pretty much in sync, rising and falling like two riders on a tandem bike.
Before the COVID-19 crisis – or “the great cull” as my Australian friends call it – those preliminary investment returns reported to boards and the press were reasonably accurate reflections of the portfolio’s trendline for the previous twelve-months.
Not this year.
Here’s the problem. Public market results are computed and consolidated by investment custodians and reported to their clients usually within a month of the fiscal close, but private market valuations take much longer.
There is at least a three-month lag before the private market investments are valued, marked, and reported to their investors who, in turn, consolidate the data into their financial reports.
Most investment teams will not know their June 30th private investment performance until September 30th or later. In some cases, much later.
As a result, the fiscal year-end performance data released to the media later this fall by endowments, foundations and other diversified, multi-asset funds won’t tell us much.
The statements will reflect June 30th public market marks (up nicely) but March 31st private market valuations (down and dated), a recipe for confusion.
Furthermore, adding March lows to the spring rally could make for unhappy boards and donors. And heaven forbid the time spent explaining to reporters why performance really wasn’t so bad.
So here’s the conundrum. Should investment offices flush the news right away? Get it all out there and enjoy a better 2021?
Or should they hold off until every last mark is settled? Be slow rather than sorry?
We’ll see.
But for the record, most family offices and nonprofit investors have done ok this year.
So, kudos to the chief investment officers and staffs.
[See our one and five-year performance chart for 2019 below, listing one hundred endowments. We publish it as a reference and reminder of what returns in a normal year looked like.]
It’s a cold cruel world
Lamentably, the schools, health systems, museums, and cultural institutions the CIOs work for are in deep trouble.
Tuition, government aid, donor gifts, room and board revenue, and visitor and patient revenue have all collapsed.
Staff and pay cuts have hit many of the well-known institutions we work with and more are in the works.
The Pay Study we published a few weeks ago on one hundred chief investment officers incorporated the most recent comprehensive public data available, December 2017.
But we expect pay cuts as high as twenty percent from our baseline comp for some investment teams as institutional budgets implode.
We’re in the Mergers and Acquisitions Business
Read More »Pay and Chief Investment Officers: Good Money while It Lasts
by charles | Comments are closed06/20/2020

In this letter, we highlight the compensation of one hundred chief investment officers at US university endowments.
Endowment investment chiefs are the ultimate long-term, strategic investors.
They have an infinite investment horizon, a global playing field, and can invest in anything anywhere – within the broad policy limits set by their institution.
Their performance is a bellwether for what’s prudent and possible.
We recruit these executives for a living and avidly follow all institutional investment heads managing assets over $1 billion (and many with less), tracking their performance and pay, and scrutinizing their abilities.
Foundations, family offices, and Wall Street firms also employ top investment professionals, but it’s difficult to extract meaningful data on compensation or performance from opaque sources. So, we go with what we can get.
When it comes to pay, size matters
Nonprofit investors wear many hats but have essentially one metric by which they are judged; long-term performance. However, that does not seem to be the metric for how they are paid.
We ran some correlations using our archival data-sets to see how pay correlates to AUM, tenure, and five-year performance.
As shown below, the correlation coefficient for AUM to comp is 0.69, which is moderately high. But, tenure and performance don’t appear to have much impact on CIO pay.
There are some outliers, like Paula Volent at Bowdoin, a consistent top performer and deservedly well paid, managing an endowment with less than $2bn AUM. But, in most cases, size trumps all other metrics.
Comp-vs- AUM: 0.69
Comp-vs-Tenure: 0.31
Comp-vs-5yr Rtn: 0.27
In the larger corporate world CEO pay is an object of great interest and controversy for obvious reasons. But the relationship of size to compensation looks just like what we see in our set of endowment CIO data.
Kevin Hallock at Cornell University is one of the go-to experts in this field. He’s chair of their department of Labor Economics and director of their Institute for Compensation Studies. In papers with his students and colleagues he’s studied CEO pay for many years.
He says: It doesn’t matter whether company size is measured as assets, market value, sales revenue or number of employees — bigger firms pay more … way more.”
“We can isolate the impact of all kinds of other characteristics (e.g., industry, return on assets, profitability, research and development expense, etc.) and even use complicated statistical techniques to remove the influence of “unmeasurable” characteristics, and the size-to-pay link remains intact.
The bottom line. Be it Wall Street, Main Street or nonprofit institutions – the bigger the assets, the better your chances at making more money.
It’s that simple.
And now, on with the show
Read More »The OCIO Dilemma: Buy, Sell, or Merge
by charles | Comments are closed05/21/2020

Active management is feeling more love these days. With the surge in institutions looking for investment help, there is new-found affection for the experience, judgement, and human touch provided by outsourced CIO firms.
But with opportunity pounding on the door, why do so few OCIOs hunger for growth? Where’s that entrepreneurial drive, that vision, passion, and focus on becoming the biggest and the best?
We have been tracking the industry for decades and have yet to see a single independent OCIO provider break through the one-hundred billion AUM level. Not one. Most will never reach twenty billion.
The OCIO business, as defined by Commonfund is…the practice of delegating a significant portion of the investment office function to a third-party provider, typically an investment management or consulting firm.
The industry, with $2.38 trillion in assets as of our latest report, is bifurcated, highly diverse, intensely competitive, and the largest six providers on our annual OCIO list – Aon, Blackrock, Goldman Sachs, Mercer, Russell and Willis Towers Watson – with their size and resources dominate the largest segment, corporate pensions.
In this segment, reality bites. There are only about three-hundred remaining internally managed corporate pensions over a billion AUM and those that outsource will chose one of the big six mentioned above or a major insurance company. Boutique OCIOs have no chance for the business.
Most new prospects dwell in the sub-$1 billion realm – endowments, foundations, health systems, charities, and associations – and smaller sub-$200 million customers including ultra-high-net-worth families and nonprofits.
The good news is that there are about fifteen hundred colleges and universities in the US (about one-hundred-fifty endowments over $1 billion and another one-hundred-fifty in the $500 million to $1 billion bracket) and several thousand foundations, health systems, charities, and associations.
The bad news is that most of the eighty-three firms on our list compete in this space along-side RIAs, brokers, and advisors. Literally hundreds of rivals.
Most of these competitors would be better off buying, selling, or merging with other providers instead of grinding away with little gain.
Here’s why.
Read More »